
Exploring Google Analytics Behavior data and reports
Jason RoyGoogle Analytics offers a wealth of information to website owners. Using that information, you can not only see where your traffic is coming from, but you can also identify how those users engage with your site and its contents.
Once you learn how visitors engage with your website and content, you can identify the most popular pages, create more of the same, improve important metrics, and even improve website conversions.
That’s great! But how do you find all this information?
The answer is Google Analytics Behavior Reports.
In summary, the Google Analytics Behavior reports let you gauge the performance of your site’s content, and these reports also tell you how visitors engage with your website and take action when they are visiting and moving through your site (or a sales funnel).
Just like other Google Analytics reports, the Google Analytics Behavior reports can be a bit daunting and overwhelming.
But don’t worry!
In this blog post, we are going to explore the Google Analytics Behavior data and reports. We will tell you where everything is and how you can use the Behavior reports to your advantage.
Let’s start from the very beginning.
How to access Google Analytics Behavior reports?
The Behavior reports can be easily accessed from anywhere within the Google Analytics dashboard.
Just click on ‘Behavior’ in the left sidebar menu.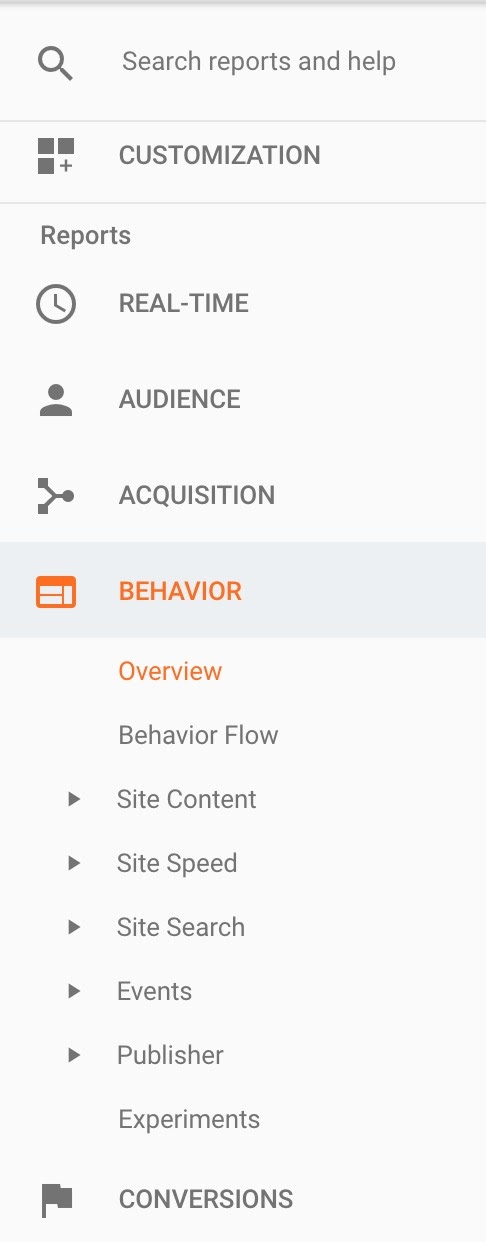
Once you click on the ‘Behavior’ section of the left sidebar, you will notice that there are 8 major segments in it.
Let’s explore each of them in the rest of the article so that you can have a thorough understanding of the Google Analytics Behavior data and reports.
1. Overview
Just like all the other reports in Google Analytics, the Google Analytics Behavior section also has an ‘Overview’ page — which is often the most important one. If you use Google Analytics in a very limited way, this ‘Overview’ page would be sufficient in conveying the most important stuff to you.
You can see the following metrics in the ‘Overview’ page.
- Pageviews — Pageviews is the total number of pages viewed during the selected time period. The important thing to understand here is that a user may visit multiple pages on your site, and each of those visits would count as a separate pageview.
- Unique pageviews — As the name suggests, this metric only measures the number of unique pageviews you receive. Unlike pageviews, if a user visits multiple web pages on your site, only his original visit would be counted in unique pageviews. The rest of the visits won’t — but they will in ‘pageviews’ as we have discussed earlier.
- Average time on page — It shows the average amount of time users spend viewing a page on your site.
- Bounce rate — The percentage of single page-visits that didn’t lead to another page visit. For instance, if someone visits a web page on your site and doesn’t visit another page, it’s called a ‘bounce’.
- Exit percentage — The exit percentage shows how often users exit from a page or set of pages when they view the page(s). Exit % is often confused with bounce rate, but they’re not the same. If you want to learn the differences between them, read this explanation by Google: Exit Rate vs. Bounce Rate.
2. Behavior flow
The second segment in the Google Analytics Behavior section is an interesting one. It tells you the path that your website visitors take on your site (or, the flow).
In other words, it maps their path from the first page they visit to the last page on your site. The behavior flow looks like this.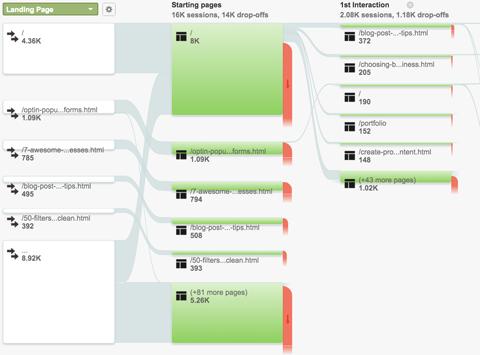
This is a fantastic visual representation of how your visitors flow through your website, which pages they visit, where they exit, and how they interact and engage with your overall website.
3. Site content
For most bloggers and business owners, this would be the most important page in the Behavior section.
The ‘Site content’ section is further divided into four sub-sections:
- All Pages
- Content Drilldown
- Landing Pages
- Exit Pages
For most webmasters, ‘All Pages’ and ‘Landing Pages’ would be interesting sub-sections to explore.
In a nutshell, in the ‘Site Content’ section, you can identify the web pages that perform the best — in terms of traffic, bounce rate, revenue, exit %, unique pageviews, etc.
4. Site Speed
The loading speed of your website is an extremely important aspect — which not only directly affects your search engine ranking but also impact conversion rates.
You can see several important metrics, such as average page load time, average redirection time, etc. Moreover, the Site Speed Overview page also tells you how long each browser takes to load your website.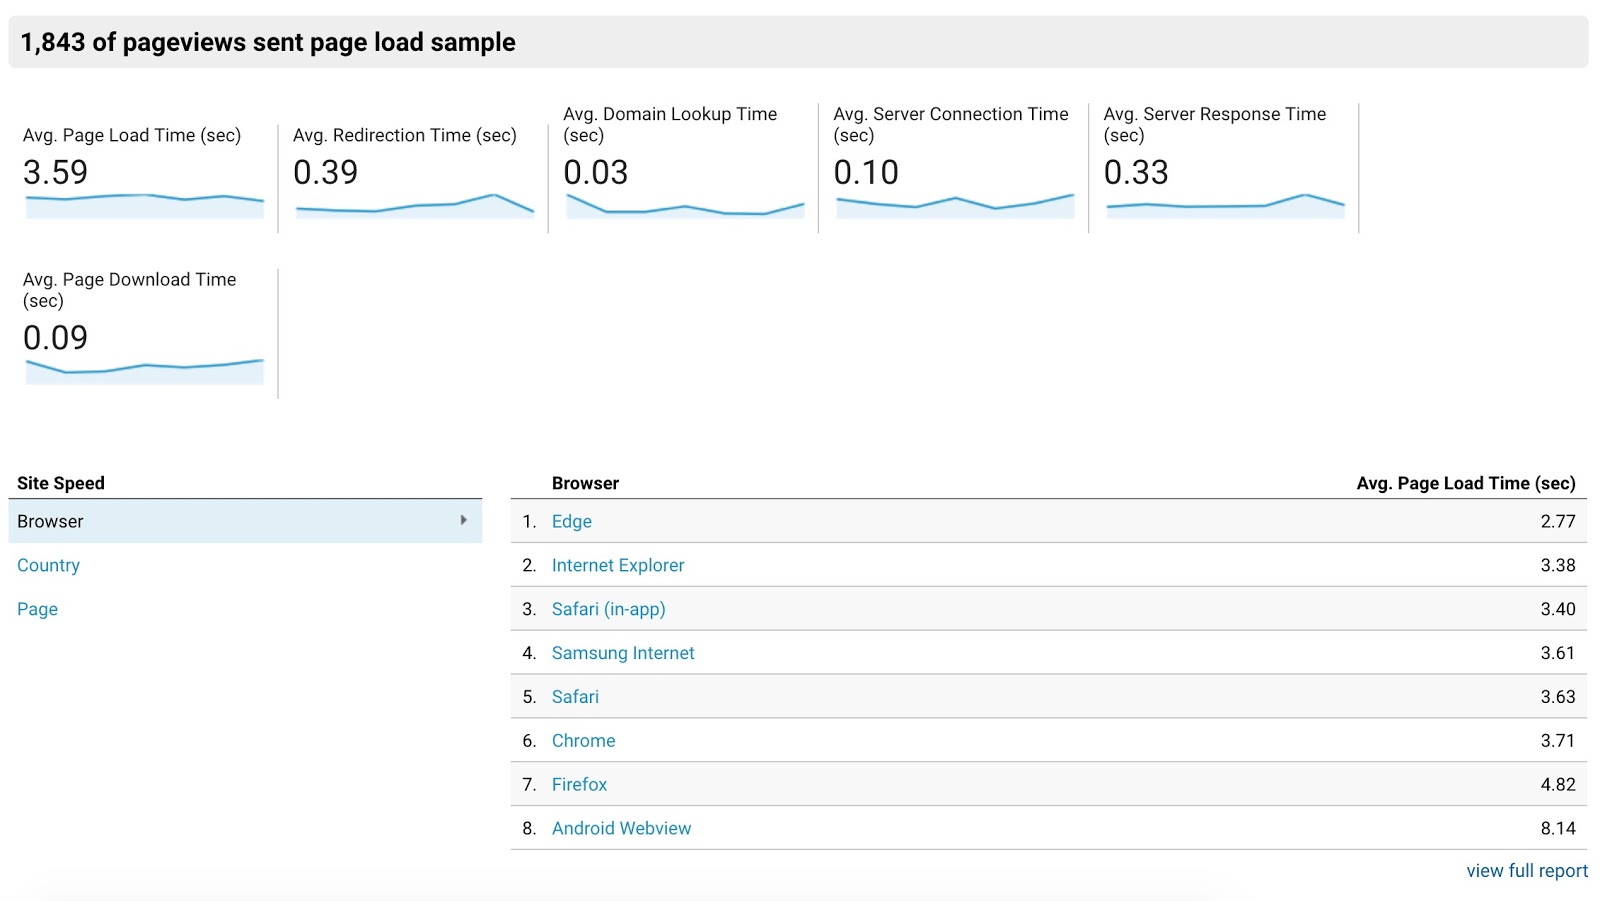
Other subsections in the Site Speed segment are:
- Page timings — You can see how long your most visited web pages take to fully load.
- Speed suggestions — You can get detailed advice from Google on how to improve the loading speed of your website.
- User timings — Measure how fast specific elements on a page load.
5. Site Search
If you want to find information on how users interact with your website’s search box, Site Search is the perfect segment for it.
You can see the overall metrics for visitors who use the search box on your website. Furthermore, by diving into its subsections (usage, search terms, pages), you can get even more relevant information, e.g., the possible impact of bounce rate and average time on pages with or without a search box, the keywords used in the search box, and the pages from where the search is originated.
6. Events
If you have set ‘Events’ in your Google Analytics, you can click on ‘Events’ in the ‘Behavior’ reports to get relevant information.
As you must know, Events in Google Analytics are used to track specific interactions on your website, e.g., playing a video, clicking a CTA button, downloading a file, etc.
The subsections — all very self-explanatory — are:
- Overview (for a bird’s eye view)
- Top Events (for finding the most recorded events)
- Pages (for identifying the pages where the events happened)
- Events Flow (for a visual representation of the events, similar to the Behavior Flow)
7. AdSense
If you use Google AdSense to generate income from your website, check out the AdSense section for all the relevant information, e.g., AdSense Revenue, AdSense Revenue per 1000 sessions, number of ads clicked, AdSense CTR, etc.
Note: You must link your Google AdSense and Google Analytics account to find this data.
8. Experiments
Experiments allow you run A/B tests to optimize your landing pages and help you identify the elements that contribute to a better conversion rate.
What’s next?
Hopefully, this article would have given you a thorough understanding of each section of the Google Analytics Behavior reports. Moreover, you should have also gotten a few different ideas that you can explore with the help of this data to improve traffic, engagement, and conversions on your site.
If you are interested in learning more about Google Analytics and the various reports the tool offers, read the following articles:
- Pricing
- Free Tools
- Articles
- Login
- Free 7-Day Trial